")
Reports are one of the most important tools to evaluate your team’s and project’s success. Preparing them on the other hand is usually a hassle. Almost no one wants to spend hours gathering data, putting it together and then presenting the results. The good news is that now you don’t have to. All you need is the right tool for the job and ability to modify the reports in a way that makes sense for your needs. The rest is a job for your project management solution Eylean Board.
We at Eylean know the value of a good report and getting timely information can be the difference between getting ahead of the competition and legging behind. That is why all of the reports offered at Eylean Board are always live. Someone just moved a task back, finished one or added new ones? Everything will be immediately reflected for you to be as informed as needed.
So what reports will your find at Eylean? Let’s take a look at the first part of the reports used in all project management practices.
Dashboard
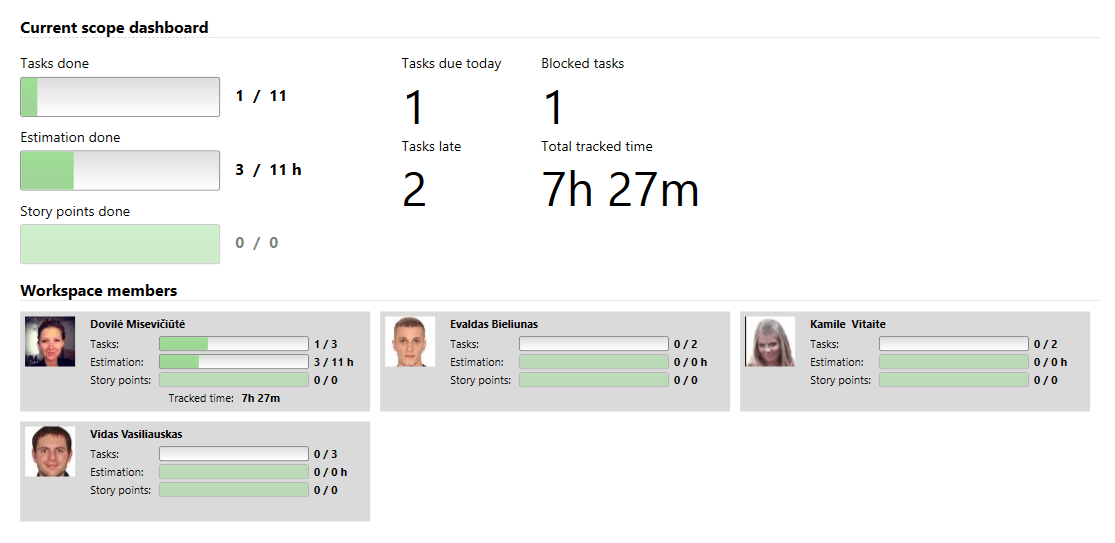
The dashboard is the most concise and the first report you will see in Eylean. And that is no accident – it is a one stop place to check on the team’s progress, overdue and blocked tasks. As well as quickly over-viewing each team member’s productivity and load.
Workflow Report
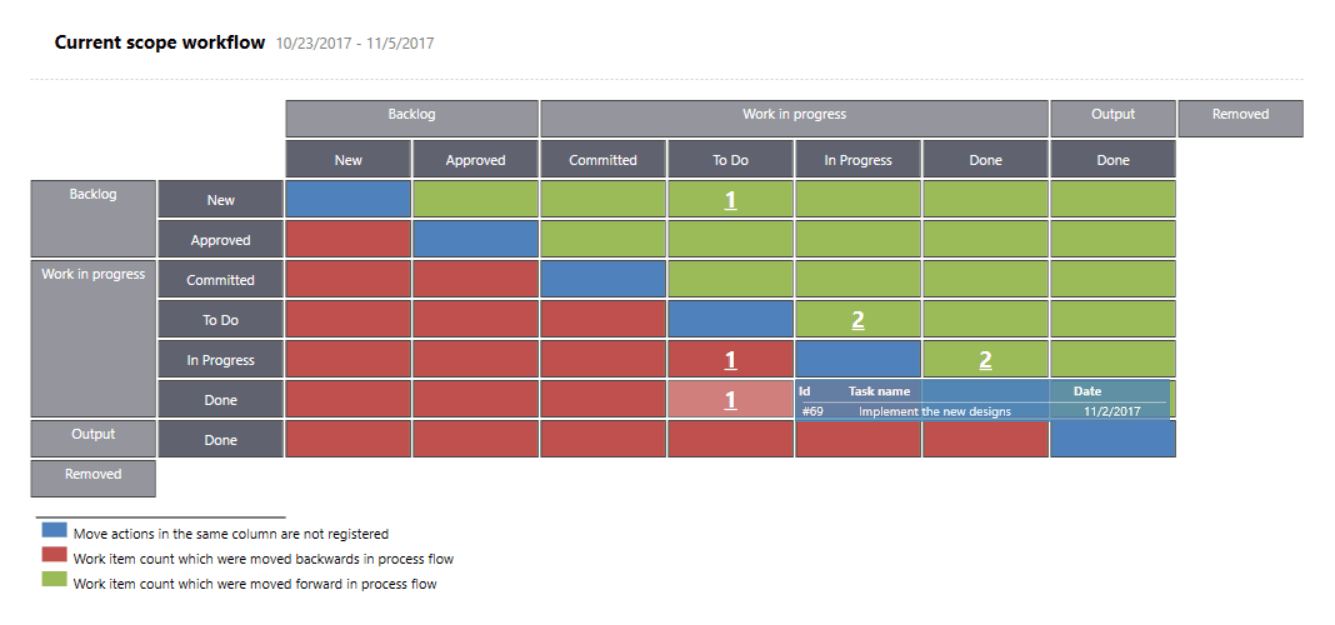
The workflow report is aimed at those whose want to not only know which tasks have been completed, but also how are they being moved on the board. Maybe it is important for you to see if any tasks have been moved backward or you want to see if all tasks go through the full cycle. In any case, this report will show you that. Choose current, full scope or any precise date and analyse your workflow.
Time Reports
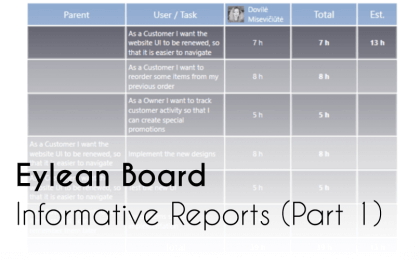
The various time tracking possibilities in Eylean would have no use without the ability to analyse them. That’s just what the tracked time reports do. You can analyse the tracked data by task, category or user and divide the data by weeks, months, specific periods or look at the whole tracked data. Giving you the possibility to see how the team performed at any given period and analyze the reasons why. The picture above shows monthly by task report.
Schedule/Roadmap View
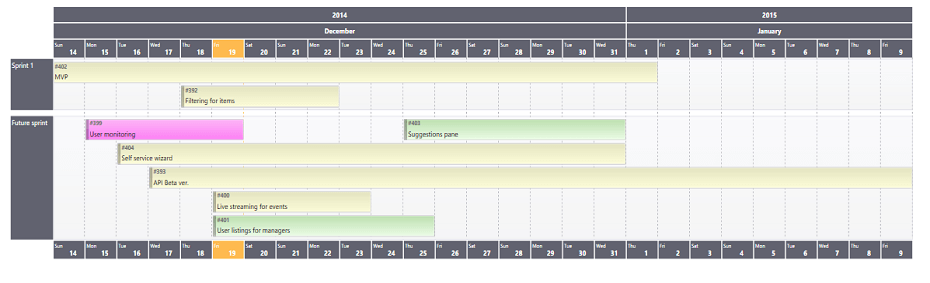
Schedule or Roadmap is the last of the reports in the general category. You will find it has its own section in Eylean Board but using it won’t feel much different from the other ones. This is our version of the Gantt chart – all your tasks displayed in a calendar view showing their duration based on the start and end dates. Thus allowing you to plan tasks and projects according to the load of the team more easily. Enter the start and end dates in the task details and it will immediately be visualized here.
Enjoyed getting to know about our general reports? Come back for the part two of the Agile reports!


