As the year nears its end most of us are looking back and evaluating our progress. To get some better insight, we decided not only to look back on ourselves, but to also look back on how did our customers use Eylean during the year. We have found some things that we expected and others that did surprise and made us think. Read on to find out our discoveries.
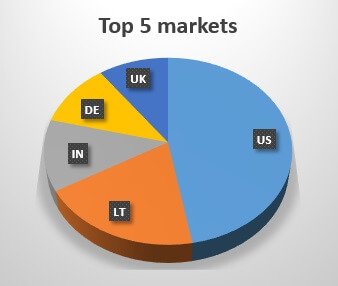 Country of origin. Just like in the previous year, we saw a growing interest in the project management (PM) software worldwide. The growth of Eylean users amounted to 81% over the year, almost doubling form last year and the biggest market for project management remained to be the United States, with 47% of the overall customers. Second place was taken by Lithuanian users, but here we might be a little bias, as Eylean itself comes from Lithuania. The first two places were closely followed by markets from India, Germany, United Kingdom and other countries all proving the exponential growth of interest in PM tools all over the world.
 Average team. Agile methodologies state that the ideal team should be kept relatively small and it seems that PM software users do agree with this rule. Teams of 1-5, 6-10 and 11-25 each make up around a 30% of Eylean Board customers with the remaining 10% taken by teams of 26 and more. From the three groups it was the group of teams of 6-10 people that grew the most, by 130% during 2014. Meaning that while small teams did dominate the market in 2014, it was the mid-sized small teams that were the most common.
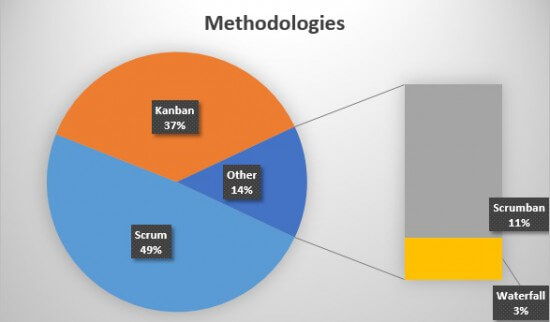
Methodology usage. This year the methodology most used by eyleaners remained the same – scrum is still the reigning champion with 49% of users. However, the number of Kanban users grew by an astounding 300%, taking up a total 37% of Eylean users. The growing interest in a looser lean methodology this year was seen from mostly non-development teams, looking for a more flexible methodology to run their projects. While there is big talk in the PM communities about using scrumban and the number of eyleaners using it actually doubled through the year, the percentage of its users remained the same as last year at 11%. Which leads us to beliave that the market is still not fully ready to implement it in their day-to-day.
Top 3 most used features. During 2014 eyleaners spent their time doing a lot of things in Eylean, but the features they used most were Task movement manipulation, Time tracking and Task naming. While we expected two of them, Time tracking took us a little by surprise when it turned out to be the second most used feature of the year. While we knew the importance of time tracking to most of our customers, this made us appreciate the demand even more and assured of the necessity to have the ability to track time comfortably with Eylean.
Top 3 most used reports. The most used reports of 2014 (excluding the dashboard) were: Monthly by task – 18%, Burndown by task – 10% and Lead time chart – 5%. It seems that most teams were keen on tracking and monitoring tasks in various ways. The fact that there are no user specific reports in the top three also indicates that while time tracking was used heavily, it did not place focus on separate user performance and was used to better estimate and understand the progress of the project.
Overall, we see a growing interest in the PM tools worldwide from various, but mostly small to medium teams. There is some shifting with the methodologies being used, which comes from more and more non-development teams adapting agile practices. Which means that PM tools need to become more flexible to accustom varying teams which may place great importance on a variety features such as time tracking.


