Written by: Dalia Lasaite
In order to improve, every team needs to monitor and evaluate its performance. There are two key tools for measuring performance in Kanban: the Cumulative Flow Diagram, which we covered in a previous blog post, and the Lead and Cycle Diagram. Lead and cycle diagram measures two indicators – lead and cycle times. This blog post reviews lead and cycle times and how to use them to increase team’s performance.
The image bellow shows the definition of Lead Time and Cycle Time.
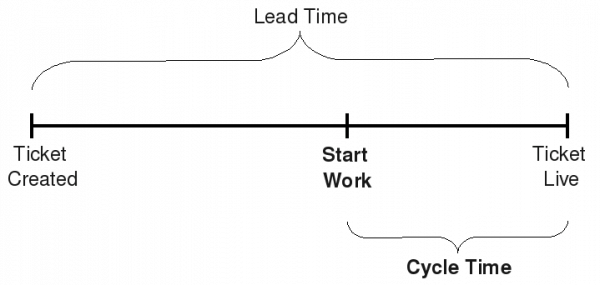
Image source: http://stefanroock.files.wordpress.com/2010/03/leadtimes3.png
Lead time measures the time between the request and the delivery of a task, including all stages within your Kanban workflow. For example, if the task spent two weeks in the queue and then was done within 3 days, the Lead Time will be two weeks and three days.
Cycle time measures the time between the moment when the team member started working on a task until its completion. In case there are multiple stages, the Cycle Time is only measured specifically for each stage. Taking the previous example, the Cycle Time would be just 3 days – as that is the time the team members worked on the task.
Both of these metrics are supported by Eylean – below you can see the Lead and Cycle Diagram available in Eylean.
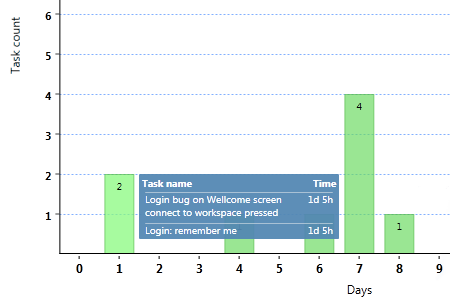
Lead and Cycle Time Diagram allows seeing very clearly which tasks take more than expected and thereby can help you improve planning processes. For example, the chart above shows that Lead Time for four tasks is 7 days, and that is something that can be improved by analyzing the nature and type of these tasks.
In order to make the process more efficient, Lead and Cycle times should generally be as small as possible. There are several options for reducing the lead and cycle times. Firstly, and most importantly, it is crucial to monitor the board and see problems when they arise. Secondly, smaller WIP limits generally reduce cycle time. Having smaller WIP limit reduces the opportunity to work on multiple tasks simultaneously, and thus reduces the cycle time. Thirdly, the same effect is achieved by making task units smaller – the cycle time is reduced. Finally, reducing variability of the tasks as well as decreasing the queue will reduce both lead and cycle times.
Lead and Cycle times are extremely important, but they should be monitored not only by the project manager, but also by the whole team. In that way, all the team will get instant feedback into the bottlenecks and issues, removing bottlenecks in their daily routine and potentially bringing their performance to a completely different level.
Do you use Lead and Cycle times to measure performance? Share your best tips in the comments!


